Перейти к основному содержанию

Как в Excel создать диаграмму с датой и временем по оси X?

В Excel мы обычно вставляем диаграмму, чтобы лучше описать данные. Но в некоторых случаях, когда вы создаете столбчатую / линейчатую / линейную диаграмму на основе ряда даты и времени, ось X диаграммы может отображаться, как показано на скриншоте ниже. В этой статье я расскажу, как правильно отображать дату и время по оси X на диаграмме.
диаграмма документа с датой и временем 1

Правильно создать диаграмму с датой и временем по оси X


стрелка синий правый пузырь Правильно создать диаграмму с датой и временем по оси X

Чтобы правильно отображать дату и время, вам нужно только изменить параметр в Ось формата Диалог.

1. Щелкните правой кнопкой мыши по оси X на диаграмме и выберите Ось формата из контекстного меню. Смотрите скриншот:
диаграмма документа с датой и временем 2

2. Затем в Ось формата панель или Ось формата диалога под Параметры оси вкладка, проверка Ось текста вариант в Тип оси раздел. Смотрите скриншот:
  диаграмма документа с датой и временем 4
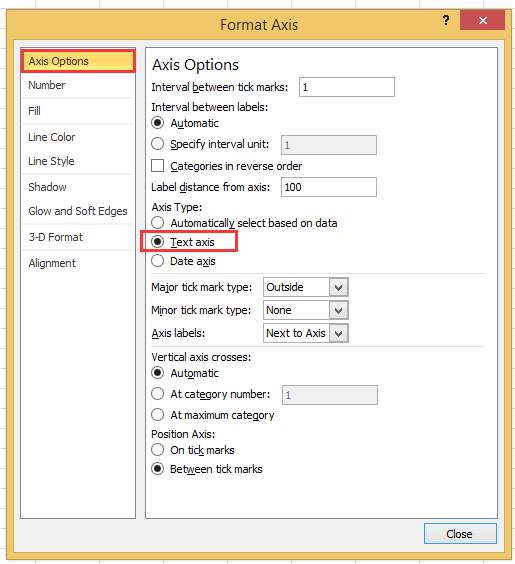
Если вы используете версию Excel позже 2010, вы увидите всплывающую панель «Ось формата» и установите флажок «Ось текста» в разделе «Тип оси» в группе «Параметры оси».
диаграмма документа с датой и временем 3

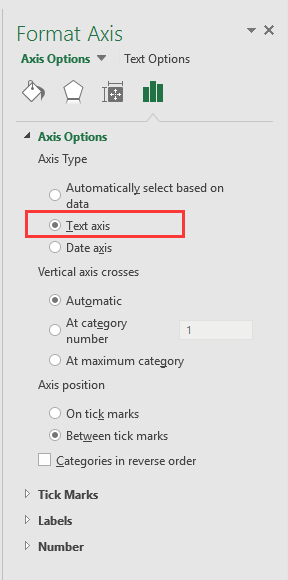
3. Нажмите Закрыть или вернитесь к диаграмме, тогда дата и время будут правильно отображаться по оси X. Смотрите скриншот:
диаграмма документа с датой и временем 5


Создайте диаграмму спидометра с двумя шагами!

Иногда вам может потребоваться использовать диаграмму спидометра для отображения стоимости проекта, но в Excel для создания диаграммы спидометра требуется много шагов, что является сложным и тратит время. Здесь Таблица спидометра инструмент в Kutools for Excel может помочь вам создать стандартную диаграмму спидометра с помощью двух простых шагов. Загрузите этот инструмент с бесплатной 30-дневной пробной версией прямо сейчас.
doc спидометр диаграмма

Лучшие инструменты для офисной работы

🤖 Kutools AI Помощник: Революционный анализ данных на основе: Интеллектуальное исполнение   |  Генерировать код  |  Создание пользовательских формул  |  Анализ данных и создание диаграмм  |  Вызов функций Kutools...
Популярные опции: Найдите, выделите или определите дубликаты   |  Удалить пустые строки   |  Объедините столбцы или ячейки без потери данных   |   Раунд без формулы ...
Супер поиск: Множественный критерий VLookup    VLookup с несколькими значениями  |   VLookup по нескольким листам   |   Нечеткий поиск ....
Расширенный раскрывающийся список: Быстрое создание раскрывающегося списка   |  Зависимый раскрывающийся список   |  Выпадающий список с множественным выбором ....
Менеджер столбцов: Добавить определенное количество столбцов  |  Переместить столбцы  |  Переключить статус видимости скрытых столбцов  |  Сравнить диапазоны и столбцы ...
Рекомендуемые функции: Сетка Фокус   |  Просмотр дизайна   |   Большой Формулный Бар    Менеджер книг и листов   |  Библиотека ресурсов (Авто текст)   |  Выбор даты   |  Комбинировать листы   |  Шифровать/дешифровать ячейки    Отправлять электронные письма по списку   |  Суперфильтр   |   Специальный фильтр (фильтровать жирным шрифтом/курсивом/зачеркиванием...) ...
15 лучших наборов инструментов12 Текст Инструменты (Добавить текст, Удалить символы, ...)   |   50+ График Тип (Диаграмма Ганта, ...)   |   40+ Практических Формулы (Рассчитать возраст по дню рождения, ...)   |   19 Вносимые Инструменты (Вставить QR-код, Вставить изображение из пути, ...)   |   12 Конверсия Инструменты (Числа в слова, Конверсия валюты, ...)   |   7 Слияние и разделение Инструменты (Расширенные ряды комбинирования, Разделить клетки, ...)   |   ... и более

Улучшите свои навыки работы с Excel с помощью Kutools for Excel и почувствуйте эффективность, как никогда раньше. Kutools for Excel предлагает более 300 расширенных функций для повышения производительности и экономии времени.  Нажмите здесь, чтобы получить функцию, которая вам нужна больше всего...

Описание


Вкладка Office: интерфейс с вкладками в Office и упрощение работы

  • Включение редактирования и чтения с вкладками в Word, Excel, PowerPoint, Издатель, доступ, Visio и проект.
  • Открывайте и создавайте несколько документов на новых вкладках одного окна, а не в новых окнах.
  • Повышает вашу продуктивность на 50% и сокращает количество щелчков мышью на сотни каждый день!
Comments (23)
No ratings yet. Be the first to rate!
This comment was minimized by the moderator on the site
I have the same issue when graphing data that has date AND time: points on the graph are equally spaced, whereas the underlying data has unequal gaps between datapoints. Data is in the form "dd/mm/yyyy hh:mm" formatted as date/time (not text). Data spans multiple days so it's not possible to extract just the time element.
This comment was minimized by the moderator on the site
I have a chart with x-axis in time that stretches during about 6h and 35min. I have data for each 20min in the beginning, then 15min and lastly each 10min. Also, in between I have 45min and 5min data.. The issue that I have, and several others, is that each gap between the date are equally spaced out. Meaning that, even if it is only 5min the gap is the same as if it was 45min.
This comment was minimized by the moderator on the site
i want to make a line graph which contains thousand of entries it's included date, time, month and year, so please help me out.
This comment was minimized by the moderator on the site
Hi, syed Mubashir alam, I do not understand your quetion, if you just create a line graph and the x-axis contains month/day/year hour:minute as below screenshot shown:
https://www.extendoffice.com/images/stories/comments/sun-comment/line-chart-1.png
just follow above steps of the article. If your question is about the axis contents are to long, there is no good idea.
This comment was minimized by the moderator on the site
i want to make a line graph which contains thousands of entries including time, date, month and year but i couldn't make a line graph so please help me out.
This comment was minimized by the moderator on the site
It's good coment that point is not a comma. When you want to add more numericals numbers you should use comma in excel ;)
This comment was minimized by the moderator on the site
Excel menus have changed - this is an out of date article - please update for 2020 .. e.g where is AXIS TYPE now?
This comment was minimized by the moderator on the site
I did not found Excel 2020, just 365 2019, which menus are the same as 2013,2016 version.
This comment was minimized by the moderator on the site
How do I remove days that don't have data in them. Example 8/1-8/31 but not data was captured on 8/3 or 8/4, how do I remove those dates from my graph? They are not in my data table so why is it pulling them?
This comment was minimized by the moderator on the site
Open the Excel file that holds the chart from which you want to exclude dates. Click the X-axis, located underneath the chart, so that it becomes surrounded by a small box. Right-click inside the box and choose "Format Axis" from the popup menu. Click "Axis Options" on the left side of the "Format Axis" window. Locate the three "Axis Type" options in the middle of the screen on the right side of the window. Click the radio button next to "Text axis."
This comment was minimized by the moderator on the site
Hi, I have an issue here. When I opened "Format Axis" and "Axis Options", there is no "Axis Type" choice here
This comment was minimized by the moderator on the site
Hi, Agassi, which Excel version you use?
This comment was minimized by the moderator on the site
Easy, useful, but i didn't know. Thanks a lot
This comment was minimized by the moderator on the site
But it doesnt show them in right relation to eachother. For example 2 hours and 6 hours are same in chart..
This comment was minimized by the moderator on the site
Hi Kiwi, maybe you can paint a chart to show me what you want the chart show.
There are no comments posted here yet
Load More
Please leave your comments in English
Posting as Guest
×
Rate this post:
0   Characters
Suggested Locations